VPN Trace
Previous  Next


The VPN Trace application is a user interface component that was designed to view debug output from the IPSEC Daemon as well as control the level of output generated. To open a the VPN Trace Application, use the start menu icon installed under the Shrew Soft VPN Client group.

graphic

Opening and Tracing Debug Output

To open the IPSEC Daemon log output file, click the Open Log button in the window toolbar. This automatically enables the Trace Log option as well. When the Trace Log option is enabled, any new data added to the log file is immediately displayed in the log output window. Disabling the Trace option is useful if you would like to pause and examine information that is already available.

Controlling the IPSEC Daemon Service

To Start, Stop or Restart the IPSEC Daemon application service, click the appropriate button in the window toolbar. If the user currently logged in does not have the necessary Administrative Privileges to perform these actions, the toolbar buttons will be grayed out.

Debug Output Options

graphic

To view or modify the Debug Output Options, select Options from the window File Menu. By changing these option values, you can control the level of degug information generated by the IPSEC Daemon.

Log Output Level

The log output level controls the level of debug output that is generated by the IPSEC Daemon. The possible values for this setting are the following.

None

No messages are logged to the output file.

Errors

Only error messages are logged to the output file.

Informational

Error and Informational messages are logged to the output file.

Debug

Error, Informational and Debug messages are logged to the output file.

Decode

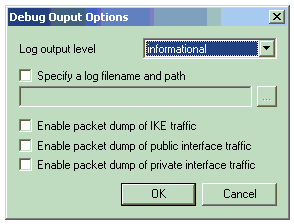
Error, Informational, Debug and Text Decode of binary data is logged to the output file.

Enable Packet Dump of IKE Traffic

When the Enable Packet Dump of IKE Traffic option is enabled, the IPSEC Daemon will create a binary packet dump of the decrypted IKE conversation that takes place between the Client and the Client Gateway.

Enable Packet Dump of Public Interface Traffic

When the Enable Packet Dump of Public Interface Traffic option is enabled, the IPSEC Daemon will create a binary packet dump of the IPSEC conversation that takes place between the Client and the Client Gateway.

Enable Packet Dump of Private Interface Traffic

When the Enable Packet Dump of Private Interface Traffic option is enabled, the IPSEC Daemon will create a binary packet dump of the traffic that passes through the Virtual Ethernet Adapter Created by the client.

Viewing Debug Packet Dumps

Packet dumps are recorded in the PCAP file format and can be viewed using the Ethereal Traffic Analyzer which has support for IPSEC packet decode. For more information regarding the Ethereal Traffic Analyzer, please visit the homepage.

http://www.ethereal.com/