VPN Trace
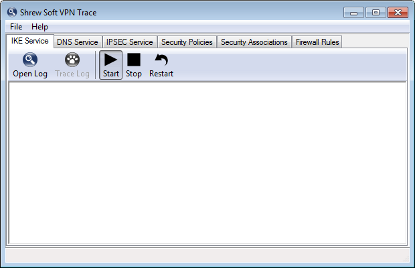
The VPN Trace application is a user interface component that was designed to view debug output from the client services as well as control the level of output generated. To open the VPN Trace Application, use the start menu icon installed under the Shrew Soft VPN Client group.
Opening and Tracing Log Output
To open a Service log output file, click the Open Log button in the toolbar. This automatically enables the Trace Log option as well. When the Trace Log option is enabled, any new data added to the log file is immediately displayed in the log output window. Disabling the Trace option is useful if you would like to pause and examine information that is already available.
Controlling the Daemon Services
To Start, Stop or Restart a Service, click the appropriate button in the toolbar. If the user currently logged in does not have the necessary Administrative Privileges to perform these actions, the toolbar buttons will be grayed out.
Viewing IPsec Security Policies
A list of active IPsec security policies are listed under the Security Policies Tab. The list is updated automatically when a client connects or disconnects from a VPN Gateway.
Viewing IPsec Security Associations
A list of active IPsec security associations are listed under the Security Associations Tab. The list is updated automatically when new associations are created or expired by the IPsec daemon during client operation.
Viewing Firewall Rules
A list of active VPN Client firewall rules are listed in the Firewall Rules Tab. These rules are managed by the different services installed by the VPN Client.
Debug Output Options
To view or modify the Debug Output Options, select Options from the dropdown File Menu. By changing these option values, you can control the level of debug information generated by the Client services.
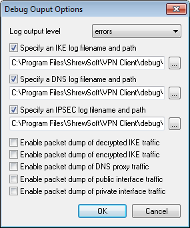
Log Output Level
The log output level controls the level of debug output that is generated by the Services. After the output level has been modified, Services need to be restarted for the new setting to be used.
The possible values for this setting:
None |
No messages are logged to the output file. |
Errors |
Only error messages are logged to the output file. |
Informational |
Error and Informational messages are logged to the output file. |
Debug |
Error, Informational and Debug messages are logged to the output file. |
Loud |
Error, Informational Debug and Loud Debug messages are logged to the output file. |
Decode |
Error, Informational, Debug, Loud Debug and Text Decode of binary data is logged to the output file |
Enable Packet Dump of Decrypted IKE Traffic
When the Enable Packet Dump of Decrypted IKE Traffic option is enabled, the IKE Daemon will create a binary packet dump of the decrypted IKE conversation that takes place between the Client and the Client Gateway.
Enable Packet Dump of Encrypted IKE Traffic
When the Enable Packet Dump of Encrypted IKE Traffic option is enabled, the IKE Daemon will create a binary packet dump of the encrypted IKE conversation that takes place between the Client and the Client Gateway.
Enable Packet Dump of DNS Proxy Traffic
When the Enable Packet Dump of DNS Proxy Traffic option is enabled, the DNS Proxy Daemon will create a binary packet dump of all DNS packets it inspects.
Enable Packet Dump of Public Interface Traffic
When the Enable Packet Dump of Public Interface Traffic option is enabled, the IKE Daemon will create a binary packet dump of IKE conversation that takes place between the Client and the Client Gateway.
Enable Packet Dump of Private Interface Traffic
When the Enable Packet Dump of Private Interface Traffic option is enabled, the IPsec Daemon will create a binary packet dump of the traffic before outbound IPsec processing and after inbound IPsec processing.
Viewing Debug Output
Client debug output is stored under a directory named debug below the VPN Client installation directory. All log and packet dump files are stored in this location by default. The information stored in this directory is often helpful for a developer to review when attempting to resolve an issue.
Packet dumps are recorded in the PCAP file format and can be viewed using the Wire Shark Traffic Analyzer ( formerly Ethereal ) which has support for IKE and IPsec packet decode. For more information regarding the Wire Shark Traffic Analyzer, please visit their homepage.
Copyright © 2010, Shrew Soft Inc